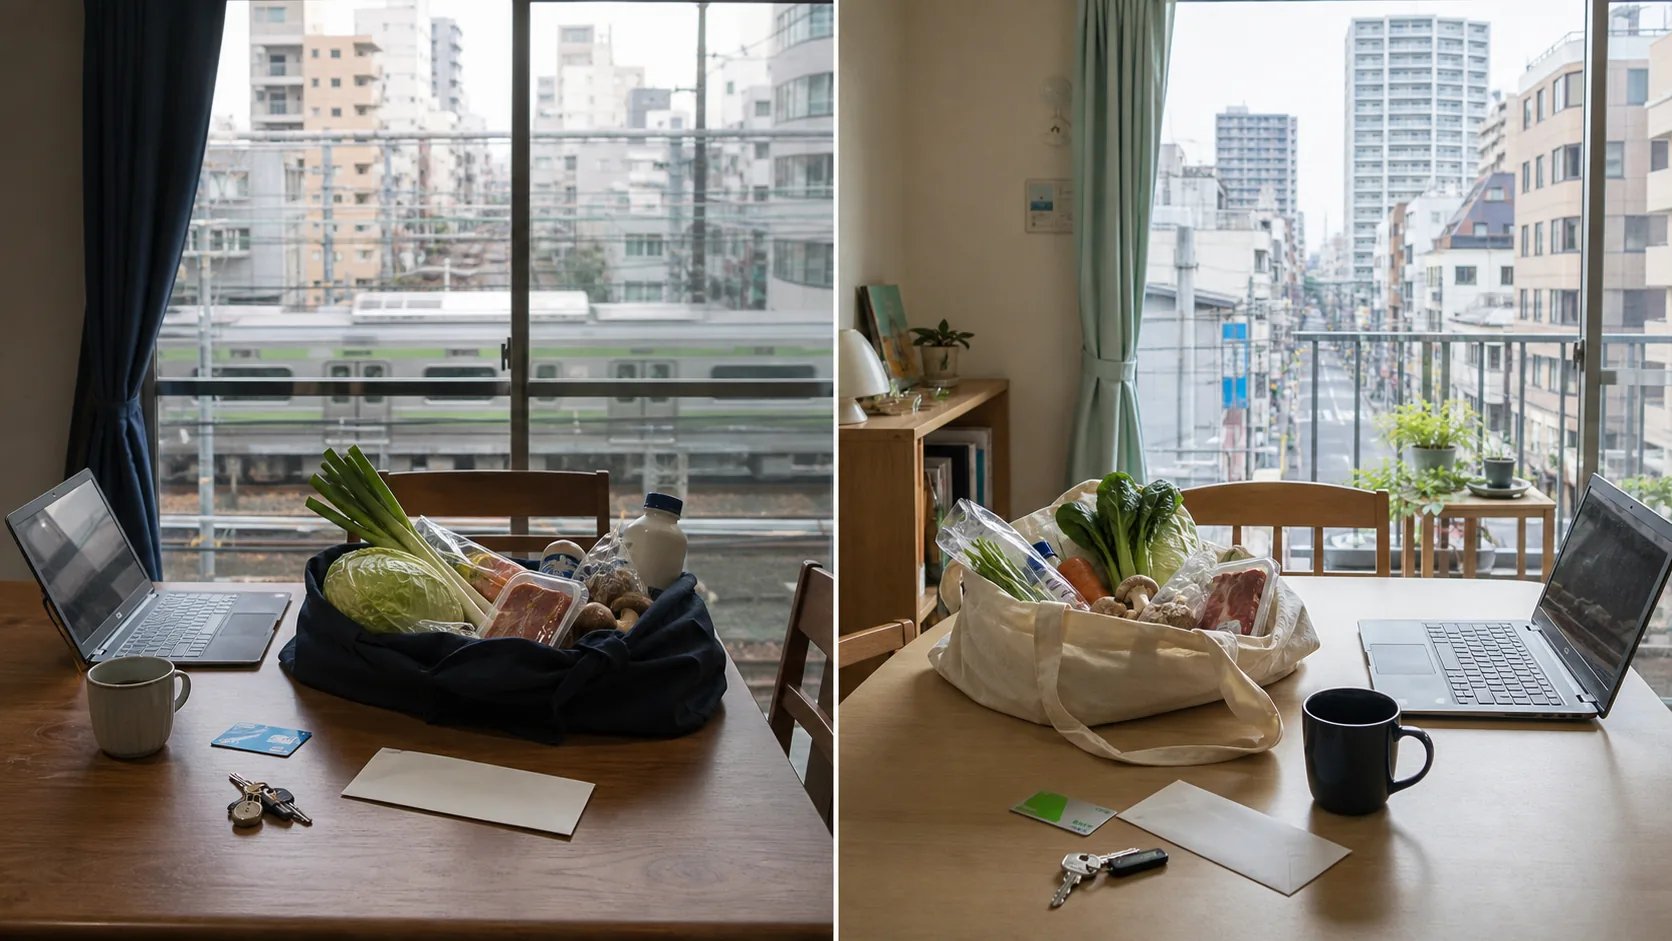
The cost of living in Tokyo vs Osaka cannot be reduced to one reliable percentage. Tokyo often has the higher housing ceiling, but a smaller Tokyo home near work can cost less overall than a larger Osaka home plus frequent intercity travel. The correct answer comes from comparing the same household, date, unit size, tenure, commute, and lifestyle in both cities.
This guide gives you a repeatable method. It deliberately avoids a fabricated “current monthly total,” because exchange rates, household choices, and neighborhoods can move that answer faster than an article can be updated.
The answer first: housing usually decides, but not by itself
For many relocating households, rent or purchase cost creates the largest difference. Food, utilities, and daily services matter, but they rarely rescue a poor housing-and-commute choice.
Tokyo may be the better value when:
- your work and social life are concentrated there;
- living close to rail eliminates a car and long journeys;
- you accept a smaller home; or
- Tokyo offers materially better income or career options for your household.
Osaka may be the better value when:
- your work and relationships are in Kansai;
- you can secure suitable housing near daily destinations;
- you want more space within the same housing budget; or
- you will not repeatedly travel to Tokyo.
The comparison is personal. A remote worker, family with two children, retiree, and frequent international traveler should not use the same basket.
Use official data without misusing it
Japan's Statistics Bureau runs the Retail Price Survey to measure nationwide prices of important goods and services. It includes a trend survey and a structural survey designed to examine regional price structure (Statistics Bureau survey overview).
Two official tools are especially useful:
- Regional Difference Index of Consumer Prices: compares regional consumer price levels using Japan as the base and publishes results for prefectures and major cities (Statistical Yearbook explanation).
- Retail Price Survey tables: provide observed prices and charges for specified items in surveyed cities (Retail Price Survey tables).
Use the latest release available on the day you budget and record its reference period. Do not treat one item price as the city's full cost of living. The Statistics Bureau warns that monthly retail prices are simple averages of sampled observations, specifications can differ among cities, and the tables do not necessarily show precise regional differences (official notes).
Build a like-for-like monthly budget
Create two columns and hold the household assumptions constant.
| Budget line | Tokyo input | Osaka input | Best evidence |
|---|---|---|---|
| Rent or mortgage cash outflow | Actual comparable homes | ||
| Building/common fees | Listing and contract | ||
| Electricity, gas, water | Provider tariff plus prior bills | ||
| Internet and mobile | Current plan quote | ||
| Local transport | Actual commute and operator fares | ||
| Intercity travel | Expected trips, not zero | ||
| Food at home | Your basket plus official survey | ||
| Eating out | Your realistic frequency | ||
| Childcare or school | Municipality and school | ||
| Health and insurance | Employer/municipal facts | ||
| Local and national tax | Professional estimate | ||
| Car, parking, or bicycle | Address-specific quote | ||
| Travel home and emergencies | Your route and frequency |
Add a date and source beside every major input. Re-run the table if the exchange rate matters to your reporting currency.
Housing: compare a life, not an average apartment
A fair rental comparison fixes:
- usable floor area;
- building age and seismic standard;
- walking time to a station;
- door-to-door time to work or school;
- furnished or unfurnished status;
- management/common fees;
- initial contract costs; and
- renewal or move-out obligations.
For owners, replace rent with total occupancy cost:
- financing payment, if any;
- fixed-asset and city-planning taxes where applicable;
- condominium management and reserve contributions;
- insurance;
- repairs and capital replacements;
- parking; and
- purchase and eventual sale costs spread over the expected holding period.
Do not compare a central Tokyo studio with a suburban Osaka family home and call the difference “city cost.” Compare homes capable of serving the same household. Start from the full range of Tokyo houses and property for sale, then contrast Shinjuku housing, Shibuya homes, and Minato properties with homes in Osaka City, then use Explore to test commute-compatible areas.
Transport: calculate door-to-door
Rail fares alone miss the cost of time, transfers, and trips between regions. Price the routes you will actually use:
- home to workplace or school;
- airport used most often;
- weekly shopping and healthcare;
- visits to family or clients; and
- Tokyo–Osaka trips created by choosing the “cheaper” base.
If an employer reimburses commuting, record both the gross cost and your out-of-pocket amount. If a move allows you to avoid a car, include the avoided purchase, parking, fuel, tax, inspection, insurance, and maintenance costs.
Utilities: dwelling performance can outweigh city
Electricity and gas depend on tariffs and use, but the building also matters. Floor area, insulation, glazing, orientation, floor level, air-conditioning efficiency, and work-from-home hours can create a larger difference than the city name.
Request prior bills where available and ask:
- Is cooking and hot water gas or electric?
- What is the air-conditioner age and efficiency?
- Does the unit receive strong afternoon sun?
- Are windows single- or multi-glazed?
- Will someone be home all day?
Model a summer and winter peak, not only an annual average.
Food and services: use your own basket
The official Retail Price Survey covers roughly 500 goods and service items and also surveys house or room rents (Statistics Bureau Q&A). It is useful for controlled comparisons, but a household budget should reflect actual consumption.
Create a basket of 20 to 30 repeat purchases:
- rice, bread, vegetables, fruit, meat, fish, dairy, and coffee;
- household and personal-care items;
- three typical lunch or dinner formats;
- gym, haircut, childcare, or lessons you actually use; and
- delivery or imported foods, if material.
Collect prices in the same week and use the same package sizes. Do not convert only one city's yen prices into foreign currency; compare in yen first, then translate the final totals.
Taxes, healthcare, and education need household facts
These costs can dominate a family budget and are not safely inferred from “Tokyo versus Osaka.” Employment status, income, prior-year income, residence timing, dependents, municipality, school choice, and immigration status all matter.
Ask the relevant municipal office, employer, school, and qualified tax adviser for dated estimates. Keep statutory payroll or tax items separate from optional private insurance and international-school fees.
Property ownership also does not provide immigration status. Read Buying Property in Japan: Visa and Residency Myths before treating a home purchase as a relocation pathway.
A decision method that avoids false precision
Step 1: Define one household
Record adults, children, pets, work locations, school type, required bedrooms, travel, and car needs.
Step 2: Choose three viable neighborhoods in each city
Every option must meet the same maximum commute and minimum home standard.
Step 3: Use current, dated inputs
Listings expire and tariffs change. Save the URL, capture date, and note whether the number is asking, contracted, or estimated.
Step 4: Calculate annual and one-off costs
Monthly comparisons hide deposits, agency fees, furniture, moving, purchase closing costs, and annual travel.
Step 5: Stress-test
Add a rent renewal or repair, a utility spike, more intercity trips, and an adverse exchange-rate case.
Step 6: Price quality of life separately
Commute time, home size, support network, climate, and career fit are not noise. Score them alongside cost rather than pretending yen alone decides.
A reusable comparison worksheet
Use:
annual recurring cost + annualized one-off cost + unreimbursed travel + property reserve
Then report:
- yen per month;
- yen per year;
- percentage of after-tax household income;
- hours of commuting and intercity travel; and
- floor area and bedrooms obtained.
This produces a decision-useful Tokyo–Osaka comparison without claiming that every person will save the same percentage.
If you are deciding where to purchase rather than rent, continue with our ranked city decision framework and the foreign-buyer purchase guide.
Sources
- Statistics Bureau: Retail Price Survey overview
- Statistics Bureau: Retail Price Survey statistical tables
- Statistics Bureau: notes and limitations for retail-price tables
- Statistics Bureau: Regional Difference Index explanation
- Statistics Bureau: Retail Price Survey Q&A
Important note
This article is general educational information, not financial, tax, immigration, or relocation advice. Costs change and household circumstances differ. Use current official releases and written quotes for your dates, addresses, and household before deciding.